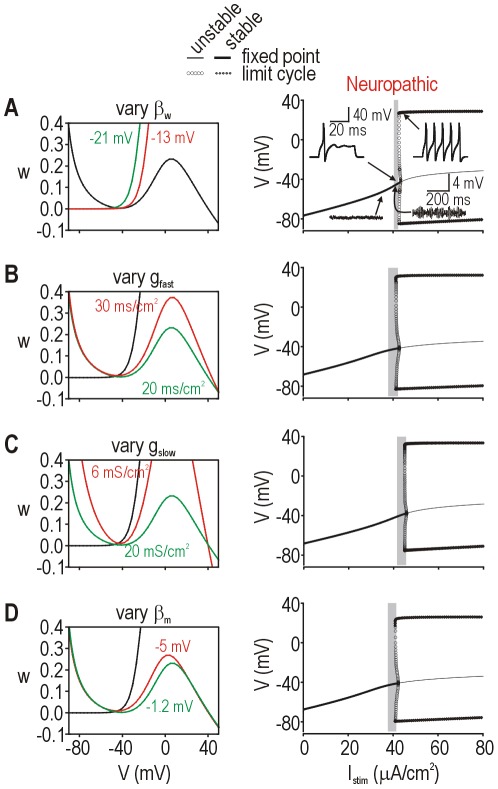
Figure 8. Dynamically equivalent effects of varying other model parameters in the 2-D model.
Effects of changing βw (A), g fast (B), g slow (C), and βm (D) in the original 2-D model. All parameters were at their default values (see Methods) except for the parameter of interest, which was varied from its default value (green) to a value causing neuropathic excitability (red) as indicated on each panel. In each case, the shape and/or positioning of the V- or w-nullcline (shown on phase planes; left panels) was affected in a distinct way, but the geometry of the nullcline intersection showed the equivalent “neuropathic” change, as evidenced by the bifurcations diagrams (right panels); specifically, all “neuropathic” bifurcation diagrams exhibit a Hopf bifurcation. For A–D, the “normal” bifurcation diagrams are equivalent and correspond to that shown in Fig. 2B top.

