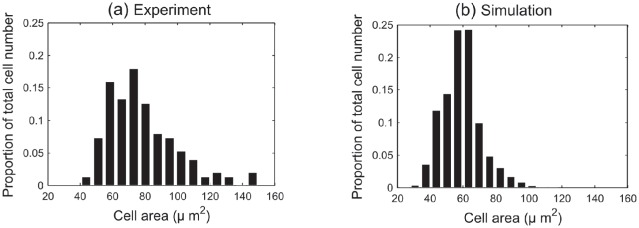
Figure 14. A comparison of model results with cell area data for three healthy murine colonic epithelium samples.
(a) Experimental data obtained from three wildtype murine tissue samples, taken from midway down the length of the colon. (b) A histogram of cross-sectional area data collected from the simulation of 1000 hours. These data have been dimensionalised, scaling 1 cell width to  , and the frequency has been averaged over total cell number to show the proportion of cells in each bin.

