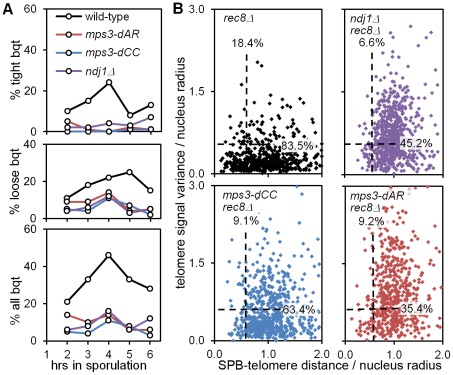
Figure 10. mps3-dCC and mps3-dAR are defective in bouquet formation and display altered patterns of telomere clustering and distribution relative to the SPB.
(A) Bouquet assay strains marked with Spc42-dsRed to visualize the spindle pole body, and with Rap1-CFP to visualize telomeres, are stained with DAPI to visualize the DNA and imaged in 3-dimensional, high-resolution, deconvolved stacks. Results are from single experiments where 200 cells per time-point were scored visually by merging the 3 individual images for each nucleus to generate a 3-color image stack that is then rotated in software to put the spindle pole body at the periphery of the nucleus as viewed in a 2-dimensional projection [9]. Cells are scored as positive when they have a single telomere cluster, within ∼1/5 the apparent nuclear volume of the spindle pole, where the cluster is tight (top panel), loose (middle panel) or either (bottom panel). Strains used: wild-type (MDY2455XMDY2513), mps3-dAR (MDY2509XMDY2511), mps3-dCC (MDY2558XMDY2560), ndj1Δ (MCY1570XMCY1571). (B) Telomere distribution and proximity to the spindle pole are quantified by software in the rec8Δ background, where cells blocked in meiotic prophase are found to have a single telomere cluster [48], unless the cells also are mutant for the ability to cluster the telomeres as in ndj1Δ and mps3-dNT [9]. Each point represents the measurements from a single nucleus, marked and imaged as in (A), above. Dashed lines lie at 0.6 on the respective axes; the associated numbers are the fractions of each population between 0.0 and 0.6. The radius of each nucleus in microns is estimated by the distance in microns from the centroid of the spindle-pole body signal to the centroid of the DAPI signal. Telomere distribution (units of microns) is estimated from the 3-dimensional variance of the Rap1-CFP signal intensity for each nucleus (units of squared microns), normalized by nucleus radius. SPB-telomere proximity (a unitless ratio) is the distance in microns between the centroid of the spindle pole body signal and the centroid of the Rap1-CFP signal, normalized by nucleus radius. Thus, a tight cluster of telomeres adjacent to the spindle pole, as in tight bouquets, would generate a SPB-telomere distance of ∼0, while a tight cluster of all telomeres at the edge of the DAPI signal but opposite the spindle pole would generate a SPB-telomere distance of ∼2. Statistical analysis in the legend to Table 1. Strains used: rec8Δ (MDY2517XMDY2534), ndj1Δ rec8Δ (MCY1533X1535), mps3dCC rec8Δ (MDY2553XMDY2555), mps3-dAR rec8Δ (MDY2557XMDY2539).

