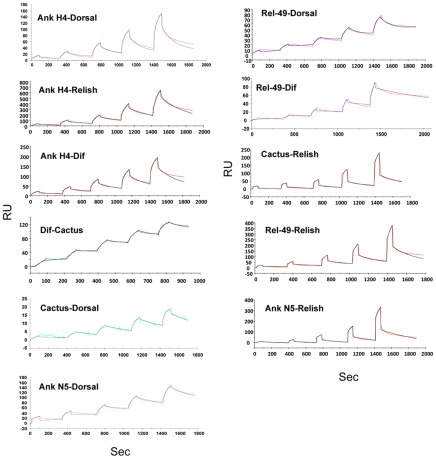
Figure 2. Kinetic titration sensorgrams of NF-κB/IκB interactions.
Each recombinant Rel protein homodimer was injected sequentially over a surface with immobilized Cactus, Rel-49, Ank-H4, or Ank-N5 for 60 or 90 s at a flow rate of 30 µL per min, with a 120 s dissociation phase between injections. The concentration of NF-κB was doubled each injection. The sensorgram represents the response units (RU) from the blank-subtracted IκB coated surface (ordinate) with respect to time in seconds (abscisa). The dark lines represent the experimental data and the red lines represent the fit to a simple 1∶1 interaction model. See Table 1 for the association rate constants (ka), dissociation rate constants (kd), and equilibrium dissociation constants (Kd) in decreasing order of affinity.

