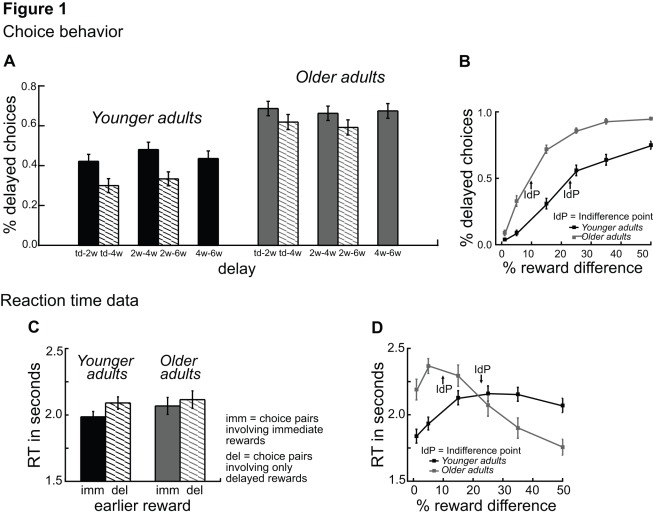
Figure 1. Age differences in choice behavior and reaction times.
A) Percentage of delayed choices (y-axis) as a function of delay (x-axis), displayed separately for younger (black) and older adults (grey). B) Percentage of delayed choices (y-axis) as a function of the % difference between rewards, displayed separately for younger (black) and older adults (grey). C) Reaction time in seconds (y-axis) for choice pairs involving immediate rewards (solid) and choice pairs involving only delayed rewards (dashed) (x-axis), displayed separately for younger (black) and older adults (grey). D) Reaction time in seconds (y-axis) as a function of the % difference between rewards, displayed separately for younger (black) and older adults (grey).

