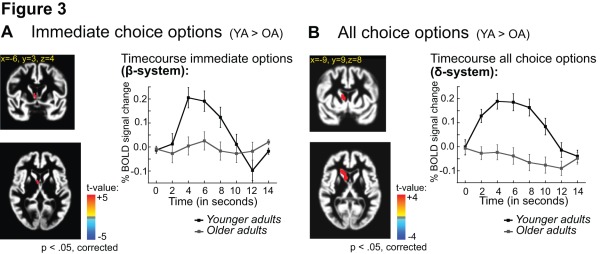
Figure 3. Age differences in striatal activity.
A) Left: Significant main effect of age group for choice options involving immediate reward in the ventromedial caudate (t-statistics, significant at p<.05, corrected for multiple comparisons). Right: Time course of BOLD signal change (on the y-axis) for younger (black) and older adults (grey). The x-axis shows time post stimulus onset in seconds. The coordinates refer to Talairach space. B) Left: Significant main effect of age group in the dorsal striatum for all choice options (t-statistics, significant at p<.05, corrected for multiple comparisons). Right: Time course of BOLD signal change (on the y-axis) for younger (black) and older adults (grey). The x-axis shows the repetition time (TR) in seconds. The x-axis shows time post stimulus onset in seconds. The coordinates refer to Talairach space.

