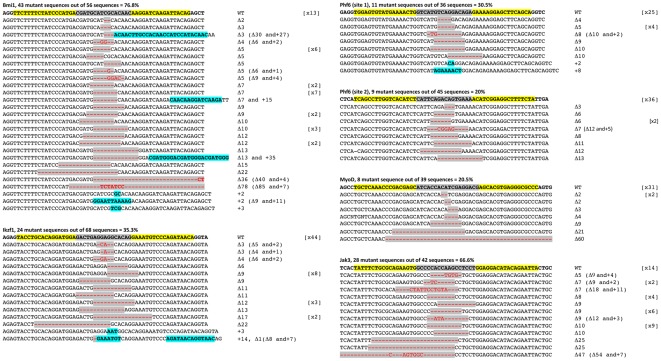
Figure 4. Sequences of somatic zebrafish gene mutations induced by TALENs.
Mutant sequences were aligned to the wild-type sequence. The length and frequency of indels are noted to the right. The target site is shown at top with each TALEN half-site highlighted in yellow and the spacer sequence highlighted in gray. Deletions (Δ) are shown in red with gray highlight, insertions (+) are shown in blue.

