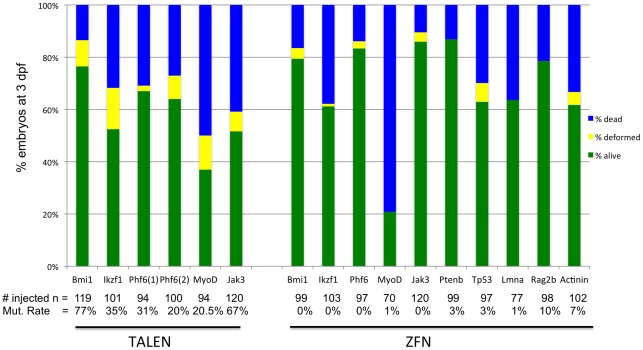
Figure 6. TALENs and ZFNs exhibit similar toxicity profiles.
The cumulative percentage of embryos that were dead or deformed by 3 days post-fertilization is denoted. CoDA ZFNs from the same genes are shown on the right. The number of fish examined for toxicity is shown below; the mutation rate is derived from a pool of 12 embryos.

