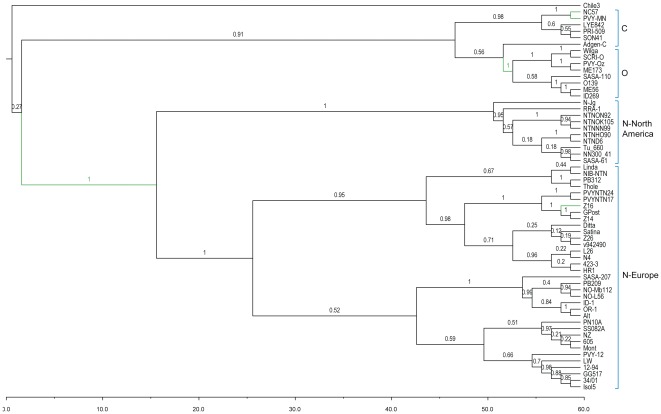
Figure 2. MCC phylogeny of 60 PVY isolates for the R1 region.
The tree was calculated from the posterior distribution of trees generated by Bayesian MCMC coalescent analyses with BEAST [55]. Posterior probabilities are indicated above branches. Branches detected to be under positive selection are shown in green.

