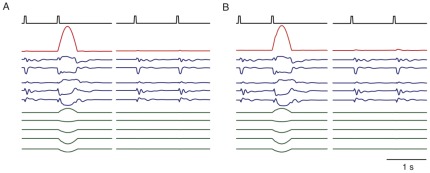
Figure 3. An example input-output task implemented in a network with feedback (A) and then transferred to a network without feedback using.
equation 21
. The upper row shows the input to the network, consisting of two pulses separate by less than 1 s (left columns of A and B) or more than 1 s (right columns of A and B). The red traces show the output of the two networks correctly responding only to the input pulses separated by less than 1 s. The blue traces show 5 sample network units. The green traces show  in A and
  in B for the five sample units. The similarity in these traces shows that the transfer was successful at getting the recurrent input in B to approximate well the feedback input in A for each unit.

