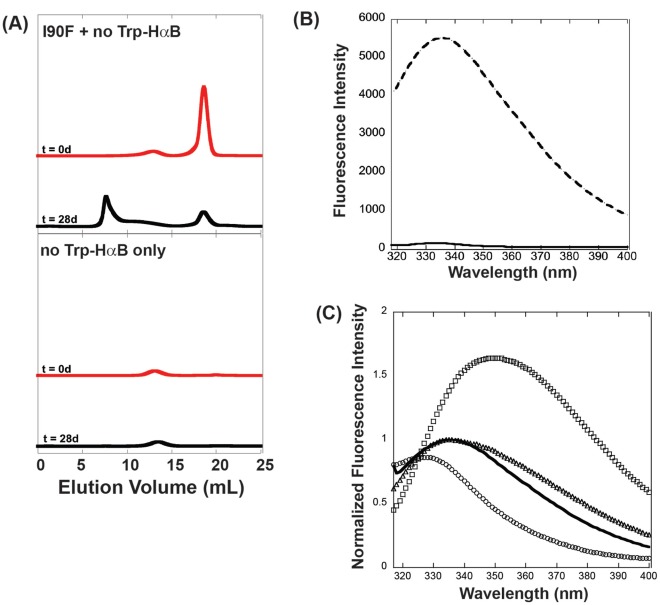
Figure 7. Analysis of native mixing for I90F and W9F/W60F-αB.
(A) Size exclusion chromatograms of I90F + W9F/W60F-αB mixtures upon initial mixing (0 days) and after the 28-day incubation at 37°C. W9F/W60F-αB alone is shown for comparison. (B) Tryptophan fluorescence comparison of WT αB (dashed line) and W9F/W60F-αB (solid line). Proteins were present at 0.05 mg/ml. (C) Comparison of tryptophan fluorescence for native I90F (open circles), denatured I90F (open squares), I90F equilibrated in 1.7 M GdnHCl, the transition midpoint of unfolding (open triangles), and I90F in complex with W9F/W60F-αB (solid black line).

