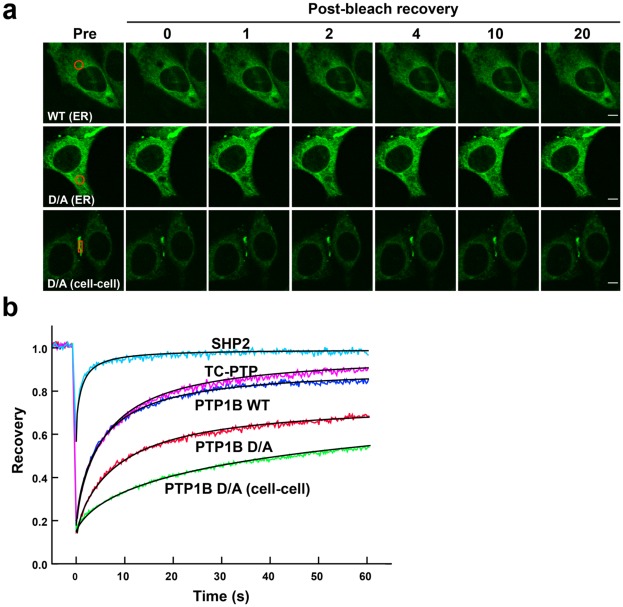
Figure 4. Assessment of PTP1B mobility using Fluorescence Recovery after Photobleaching.
(a) PTP1B-null fibroblasts expressing PTP1B WT-GFP (upper panel) were photobleached in the indicated regions at the ER (circle), and fluorescence recovery was monitored for up to a minute (images are shown for the first 20 sec). Cells expressing PTP1B D/A-GFP (middle and lower panels) were photobleached either at the ER (circle) or at regions of cell-cell contact (rectangle). Scale bars correspond to 5 µm. (b) Quantification of intracellular fluorescence recovery in multiple cells expressing PTP1B WT, PTP1B D/A, TC PTP or SHP2 (see Fig. S2 a–d). Also shown is the fluorescence recovery of PTP1B D/A at regions of cell-cell contact (see Fig. S3e). For each PTP, actual data points are presented in color, whereas solid black lines represent fits to our mathematical model. See main text and Supplementary Materials for a detailed discussion of modeling and fitting.

