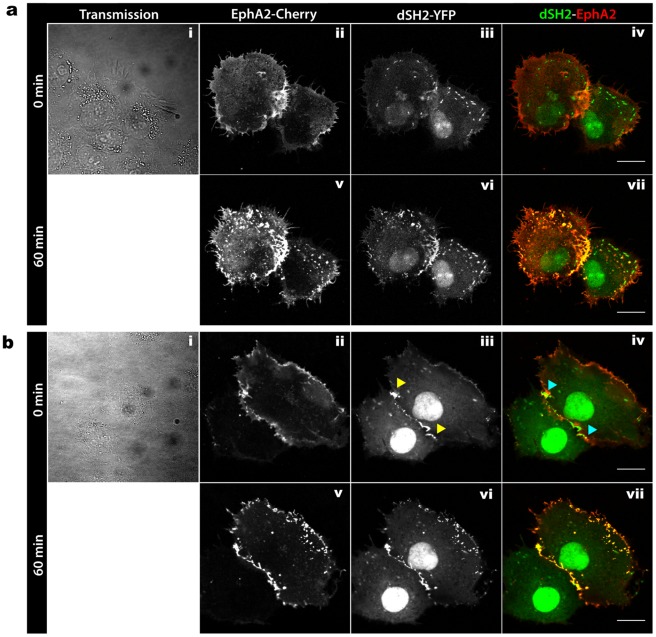
Figure 7. PTP1B accesses specific substrates at cell-cell contacts.
(a, b) Cos-7 cells co-expressing EphA2-mCherry (panels ii, v) and dSH2-YFP (panels iii, vi) were incubated for 1 hour at 37°C with PTP1B allosteric inhibitor (539741 PTP1B inhibitor, 250 µM), and monitored by confocal time lapse microscopy. Transmission images (panel i) show the cell confluency and help to define regions of cell-cell contact. Intensity merge images (panel iv, vii) showing the spatial localization of EphA2 (red) an dSH2 (green) before (iv) and after (vii) PTP1B inhibitor treatment. Note the markedly increased co-localization (orange) at regions of cell-cell contact after inhibitor treatment, indicating increased EphA2 phosphorylation specifically in this region. Scale bars correspond to 20 µm.

