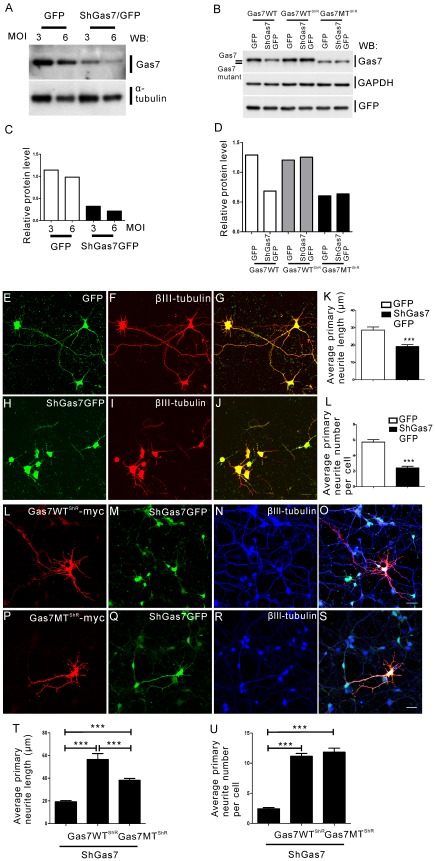
Figure 3. Comparison of the rescue ability of Gas7 wild-type and mutant protein.
GFP and shGas7GFP were inserted into pLKO.1-puro plasmid for production of lentiviral particles. The shGas7GFP specifically targets the sequence 5′-1081GTG GAA ATG ATC CGA CAA CAT1101-3′ located on the open reading frame of gas7 to knock down Gas7 expression. (A and C) Western blot showing that endogenous Gas7 efficiency was knocked down by shGas7GFP overexpression in cortical neuron primary culture. The relative protein level of Gas7 was normalized to α-tubulin. (B) Gas7WTShR and Gas7MTShR exhibit resistance to Gas7 shRNA knock down. All plasmids were transiently transfected (0.5 µg) into 293 T cells. Western blot detected Gas7, GAPDH, and GFP. The relative protein level of Gas7 was normalized to GAPDH. (E-G) Normal morphology of primary cortical neurons following overexpression of GFP. (H–J) shGas7GFP overexpression induced disruption of neurite outgrowth of primary cortical neurons. (F) and (I) Distribution of βIII-tubulin (red), a neuronal marker. (G) and (J) Merged GFP-βIII-tubulin and shGas7GFP-βIII-tubulin signals, respectively. Scale bar, 20 µm. (K) and (L) Bar graph of the average length (K) and number (L) of primary neurites in cortical neurons with shGas7GFP expression is significantly decreased as compared with GFP expression. (30 cells were calculated in each group). Data points represent mean ± SEM, ***P<0.001. (L–S) Representative images of cortical neurons with shGas7GFP and Gas7WTShR-myc co-transfection (L–O) or shGas7GFP and Gas7MTShR-myc co-transfection (P–S). (T) and (U) Bar graph of the average length (T) and number (U) of primary neurites in cortical neurons expressing shGas7GFP, shGas7GFP with Gas7WTShR-myc, or Gas7MTShR-myc expression. Data points represent mean ± SEM, ***P<0.001. No significant difference in the average number of primary neurites per cortical neuron was observed between shGas7GFP co-transfected with Gas7WTShR-myc or Gas7MTShR-myc. (25 cells were calculated in each group). Images in (L) and (P) were obtained by sequential staining with anti-myc antibody and Cy3 secondary antibody (red). (M) and (Q) show GFP expression (green). (N) and (R) show βIII-tubulin staining with anti-βIII-tubulin antibody followed by incubation with Cy5 secondary antibody (blue). Scale bar, 20 µm.

