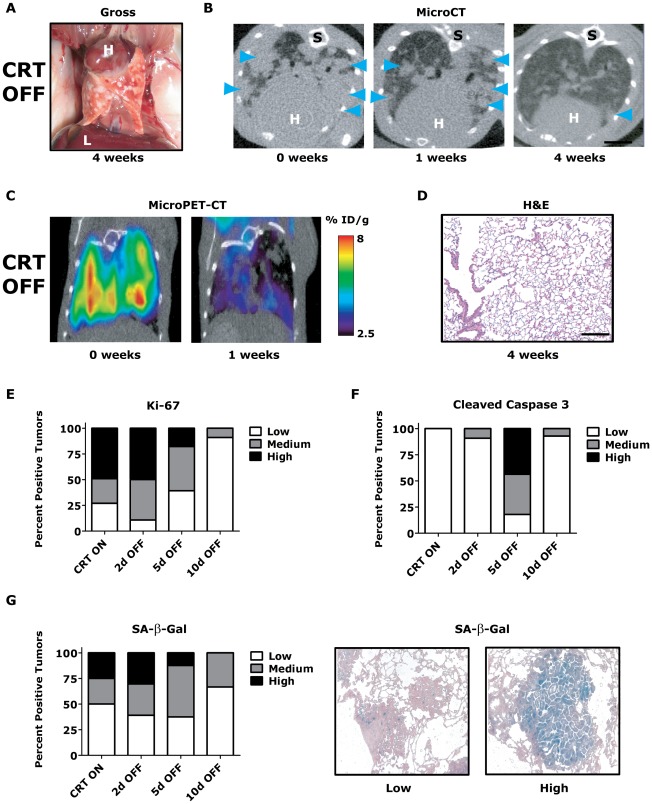
Figure 3. KrasG12D/Twist1-induced lung tumors regress following combined oncogene inactivation.
(A) Gross appearance of CRT lung tumors following 4 weeks of combined KrasG12D and Twist1 oncogene inactivation (n = 4). H – heart and L – liver. (B) Serial axial microCT of the same CRT mouse following 4 weeks of combined KrasG12D and Twist1 oncogene inactivation (n = 4) demonstrates tumor regression. Blue arrowheads denote lung tumors. S –spine. (C) Serial coronal FDG microPET-CT demonstrate decreased metabolic tumor burden after 1 week of combined KrasG12D and Twist1 oncogene inactivation (n = 2). (D) Normal appearing H&E histologic section from lung tumor moribund CTR OFF mouse following 4 weeks of combined KrasG12D and Twist1 oncogene inactivation (n = 4). Black bar equals 200 µm. CRT lung tumors demonstrate (E) decreased proliferation and (F) increased apoptosis following combined KrasG12D and Twist1 oncogene inactivation. CRT lung tumors were assayed for proliferation using Ki-67 IHC and quantified as in Figure 2E (n≥2 mice per time point). CRT lung tumors were assayed for levels of apoptosis using cleaved caspase 3 IHC and quantified (n≥2 mice per time point). Low - <1%; Med – 1–4%; and High - >4%. (G) Percentage of senescent lung tumors per mouse does not increase following combined KrasG12D and Twist1 oncogene inactivation. The level of senescence associated-beta-galactosidase (SA-β-Gal) correlates inversely with proliferative capacity of individual tumors. CRT lung tumors were assayed for levels of SA-β-Gal and quantified (n≥2 mice per time point). Low - <10%; Med – 10–30%; and High - >30%. Representative panels of tumors with “Low” and “High” SA-β-Gal staining.

