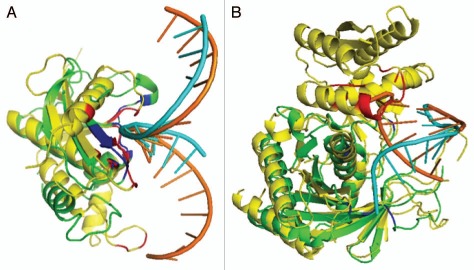
Figure 3.
Comparison between the predicted (green) and actual (yellow) complex structures for two targets with RNA structures colored in cyan for predicted and orange for native RNA structure and binding regions colored in Red for native structure and Blue for predicted structure. (A) Target 2qk9A predicted with template 1zbiB (sequence identity between them is 13%). (B) Target 1ytuB predicted with template 3f73A3 (sequence identity between them is 2.0%).

