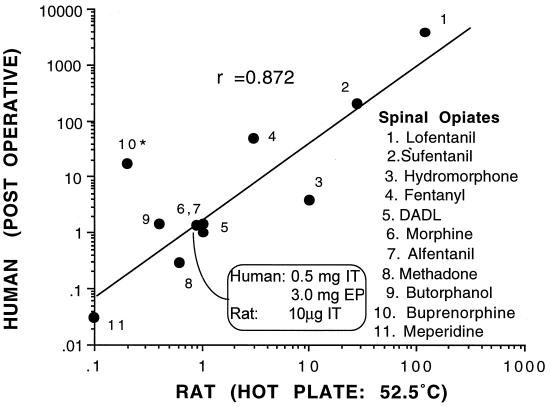
Figure 5.
Graph plots the relative intrathecal potency of several opioids as defined in rats on the hot plate test versus the relative potency when given epidurally (EP) or intrathecally (IT) in human postoperative or cancer pain. The axis plot the potency of the agent (in μg for rat or mg in human) relative to the potency of morphine given in that model. These calculations are based on a standard analgesic dose for intrathecal morphine in rats on the hot plate (10 μg) and after intrathecal (0.5 mg) or epidural (3 mg) delivery for pain in humans. Human data are based on reported doses necessary to produce an “adequate” clinical analgesia (data derived from ref. 16). DADL, d-Ala2-d-Leu5-encephalin.

