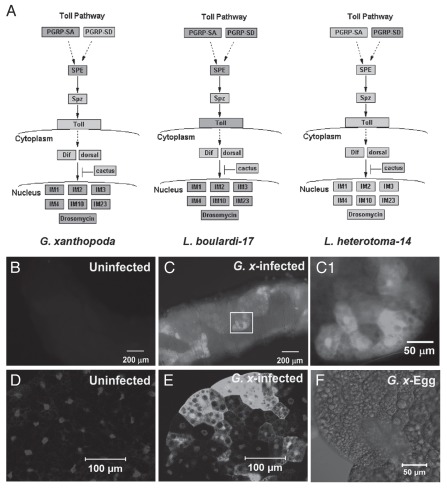
Figure 4.
Gene expression changes after G. xanthopoda-infection. Gene expression of Toll pathway components and targets in host larvae after G. xanthopoda, L. boulardi-1714 and L. heterotoma-1414 infections are shown, respectively (A). Boxes represent genes, where dark grey indicates activation and light grey indicates no change. Solid arrows indicate direct up or downstream relationship. Drosomycin-GFP larva imaged directly without infection (B) or after infection (C, inset for higher magnification, C1). Fat body dissected from an uninfected (D) or infected (E) Drosomycin-GFP larva. GFP signal is in white. Parasite egg, imaged in phase, appears as a translucent semi-circular structure on the fat body(F). Samples in (D–F) are stained with Hoechst 33258 for DNA. The staining appears white in these images

