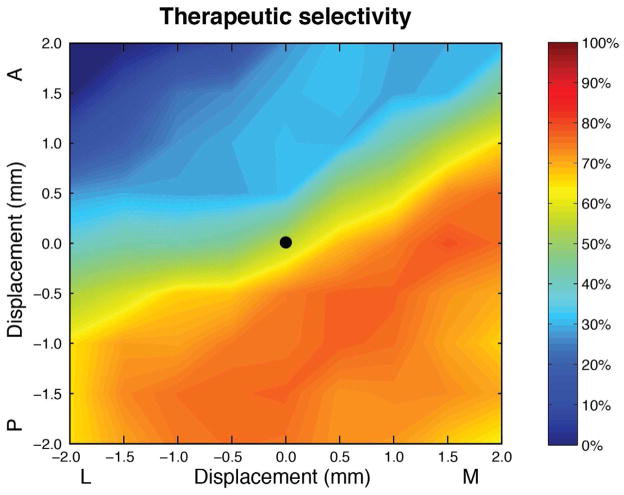
Fig 5.
Contour map depicting the maximum average selective activation of both therapeutic neural populations (STN projection neurons and GPi axons) with no internal capsule activation, using ± 5 mA (1 mA increments) bipolar stimulation settings steered between contacts 2 and 3. This metric was defined as the combined maximum average of the percent of STN neurons and GPi axons groups individually activated. We perturbated the DBS electrode ± 2 mm (0.5 mm increments) in the mediolateral (x-axis) and anteroposterior (y-axis) directions. The black dot in the center of the image depicts the default electrode location.

