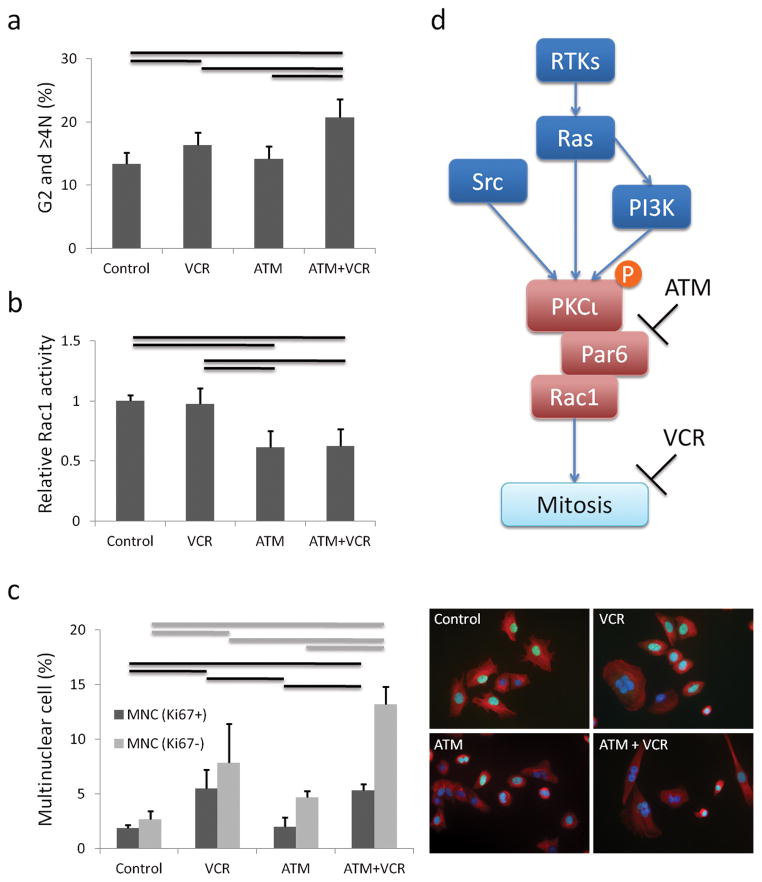
Figure 6.
Mechanism of synergy effects of ATM (25 μM) and VCR (5 nM) (a) Cell cycle analysis by FACS of cells treated with ATM and VCR. Mean ± SE were obtained from six independent experiments. Black line shows significant difference (P<0.05). (b) Rac1 activity is decreased by ATM, but not VCR. Mean ± SE were obtained from two independent experiments. Black line shows significant difference (P<0.05). (c) Immunofluorescence stain with Ki67, β-tubulin and DAPI showing non-proliferative multinuclear cells are increased by ATM and VCR. 200 cells were counted for each ICC experiment. Mean ± SE were obtained from three independent experiments. Black and gray lines show significant differences (P<0.05). (d) Schematic summary of ATM and VCR action. See Supplementary Figure S6 for representative ICC images corresponding to Figure 6c.

