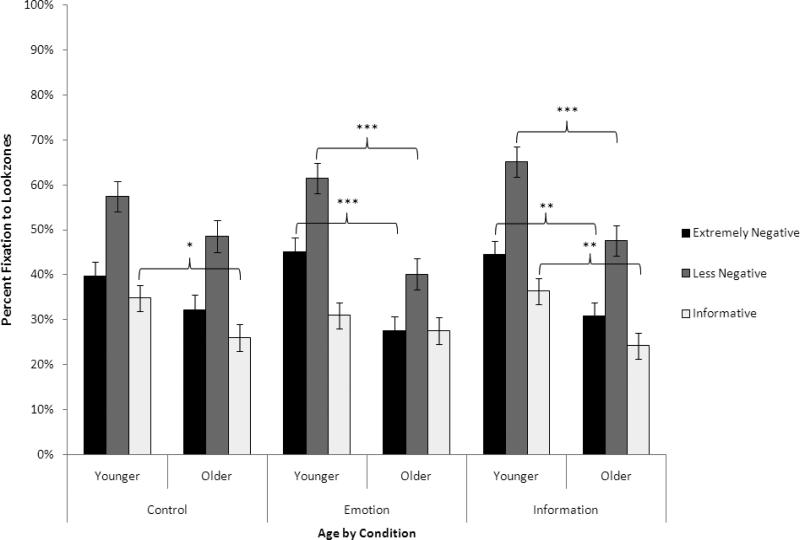
Figure 2.
Mean percent fixation values for each fixation type indicating a significant fixation × age × condition 3-way interaction. Standard errors are represented in the figure by the error bars attached to each point. Significance notation indicates the significance of mean differences between age groups using simple effect analyses: * p < .05. ** p < .01. *** p < .001.

