
Figure 2. Standard ROIs.
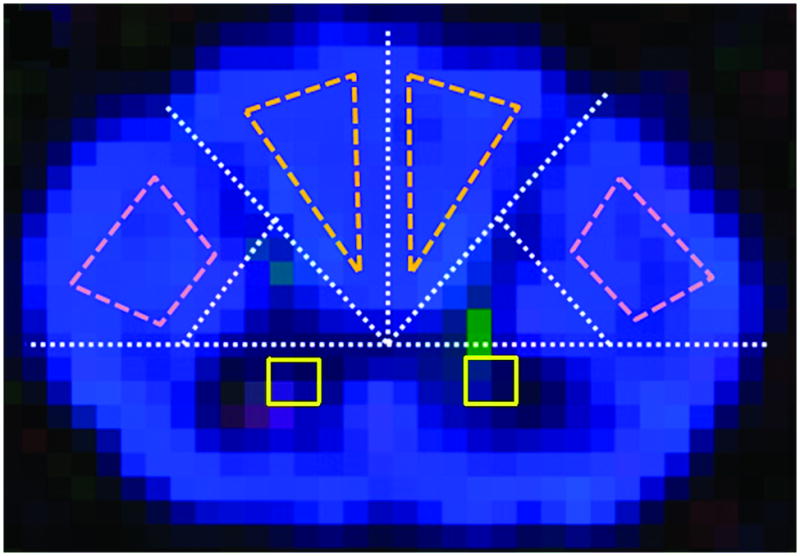
Within the axial plane, spinal cord dimensions were used to plot two white matter ROIs in the posterior columns, two white matter ROIs in the corticospinal tracts, and two central gray matter ROIs. The axial cord was separated into four quadrants by transverse and anterior-posterior lines intersecting at the central canal. The posterior spinal cord was further divided into four quadrants. A line joining the midpoints of the boundaries of the two lateral quadrants excluded central gray matter regions. ROIs of spinal cord tracts were defined in the remaining areas. For tracts, edge voxels were excluded to ensure the ROI was within white matter and to eliminate contamination by CSF. Two by two voxel gray matter ROIs were placed immediately anterior to the long axis of the cord, each located three voxels lateral to the short central axis of the cord.