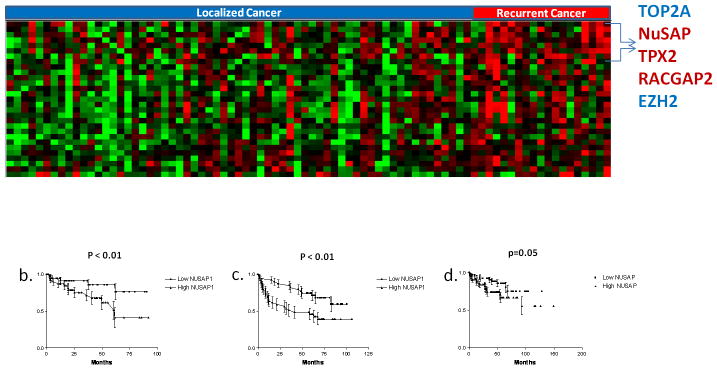
Figure 1.
a) 2-class SAM Survival analysis comparing 19 recurrent and 63 non-recurrent prostate cancer samples. A false discovery rate of 4% resulted in 28 gene transcripts differentially expressed between the two groups. Each tumor sample is represented in a column and individual transcripts are displayed in rows. Red indicates relative increased expression level of transcripts relative to the median level across the samples while green represents relative decrease in expression levels, while the degree of color saturation corresponds to the degree of change. b) Kaplan-Meier Survival analysis of NuSAP gene expression performed in our dataset. Tumor samples were divided into 2 groups based on whether the NuSAP gene expression value was above or below the median value. c) Increased expression of NuSAP is prognostic in that dataset from Glinsky GV et al. (34) and d) Taylor BS et al. (35) prostate datasets. P values calculated using the log rank test.

