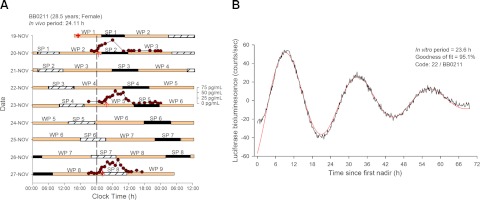
Figure 1.
A) Double raster plot of the forced desynchrony protocol of participant BB0211. A cutaneous biopsy (+) was collected during the baseline wake period (WP1) for isolating fibroblast cells used for the in vitro period assessment. After an 8-h baseline sleep period (SP1), and a 16-h baseline wake period (WP2), the participant was scheduled to a 28-h sleep-wake cycle consisting of sleep periods (black bars) of 9 h:20 min (SP2-8) and wake periods (tan bars) of 18 h:40 min (WP3-8). To better illustrate the timing of the sleep periods, consecutive sleep periods are plotted both next to (hatched and black boxes) and below each other. Melatonin profiles assessed from 3 blood sampling periods are plotted (dark red circles) together with the timing of the dim light melatonin onset (red arrows). DLMOs occurred at 00:29 (SP2); 03:25 (WP5) and 01:30 (SP8), and the derived in vivo period was 24.11. B) Detrended Bmal1-luciferase oscillation in fibroblasts from BB0211. The three full cycles included (from first nadir) in the analysis are shown in the graph, after detrending by subtracting the 24-h moving average of the data included from the raw data. The red curve indicates the largest sinusoidal component (Sin fit) in the detrended data, with its period and goodness of fit (% of variance).

