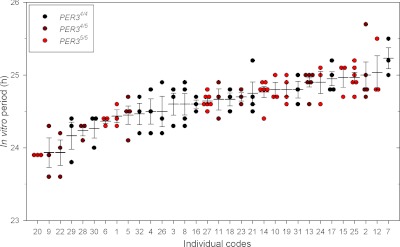
Figure 3.
Individuality and stability of in vitro period assessments in 32 participants. In each participant, 3–7 replicates of fibroblasts were cultivated and used to assess in vitro period. Each assessment (dots) as well as the mean ± se (horizontal lines) is plotted for each participant. Data are ordered from short to long periods. PER34/4: n = 13 (black circles); PER34/5: n = 8 (dark red circles); PER35/5: n = 11 (red circles). Overall ICC (95% CI) = 0.62 (0.45, 0.76), confirming individuality in these 32 human fibroblasts. Coefficient of within-individual variance (95% CI) = 0.01 (0.01, 0.01).

