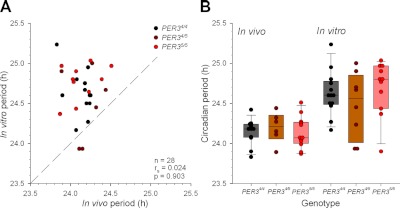
Figure 5.
A) Association between in vivo and in vitro circadian periods. Dashed line represents the line of unity. B) In vivo (PER34/4: n=12; PER34/5: n=6; PER35/5: n=13) and in vitro (PER34/4: n=13; PER34/5: n=8; Per35/5: n=11) periods by genotype. Each dot represents the circadian period for each individual. Vertical box plot represents the median (midline) with the 25th (bottom rectangle) and 75th (top rectangle) percentiles, and errors bars show the 10th and 90th percentile values per genotype. Note that the 10th and 90th percentiles could not be computed in PER34/5 (n<9) because ≥9 individual data points are required.

