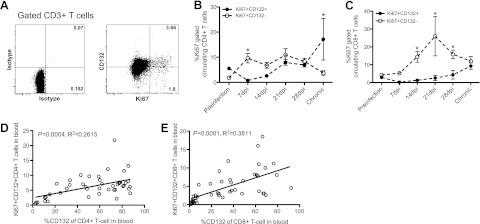
Figure 3.
Proliferation (Ki-67+) of γc+ T cells during SIV infection. A) Representative dot plots showing Ki-67 levels on γc+/γc− CD3+ T cells. B, C) Proliferation of γc+ CD4+ or CD8+ T cells compared with γc populations during SIVmac251 infection in macaques (n=21). C, D) Correlation of proliferating (Ki-67+) γc+ T cells with γc levels on CD4+ (D) and CD8+ (E) T cells in the naive and SIV-infected macaques. Error bars represent means ± se. *P < 0.01 vs. γc+ population.

