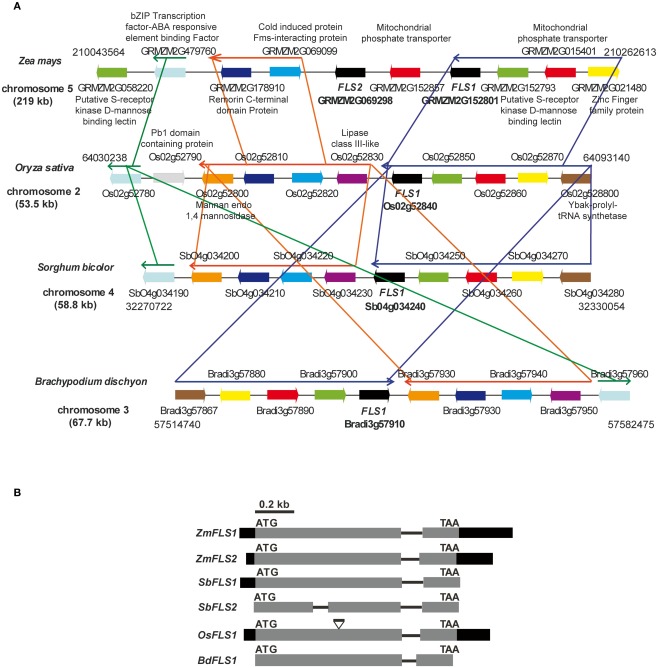
Figure 1.
Regional synteny (A) and structure of FLS genes (B) from grasses. (A) Genomic arrangement of FLS and neighboring genes in Zea mays, Sorghum bicolor, Brachypodium distachyon, and Oryza sativa. The numbers on each side indicate the localization of the regions in the chromosomes, each gene in the different species is indicated with the same color. The length of chromosomes displayed is indicated in kb. Thin arrows above the genes indicate conserved regions between species. The graph was constructed using CoGe’s Genome Evolution Analysis tool (CoGe team software) at http://synteny.cnr.berkeley.edu/CoGe/GEvo.p. (B) Exons are represented by boxes, gray and black boxes indicate coding and UTR regions, respectively, and black lines represent non-coding regions. Start and stop codons are indicated.

