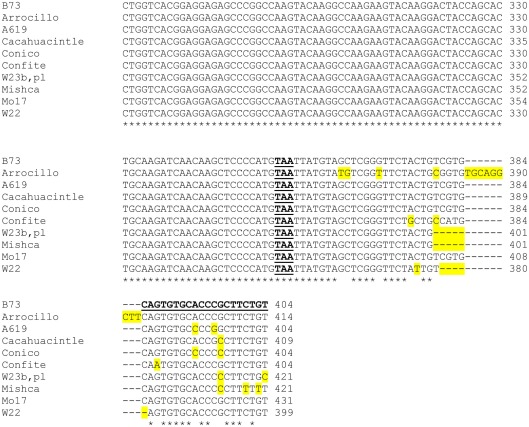
Figure A4.
Sequence comparison of partial ZmFLS1 (A) and ZmFLS2 (B) genes in different maize lines. The regions of ZmFLS1 and ZmFLS2 genes range from +740 bp (exon 1) to +1218 and +1143 bp, respectively (3′UTR). The introns in ZmFLS genes are highlighted in gray, different nucleotides and insertions or deletions are highlighted in yellow. Stop codons are indicated in bold-underlined letters. Primers used for RT-qPCR are in bold-underlined letters on B73 sequences.


