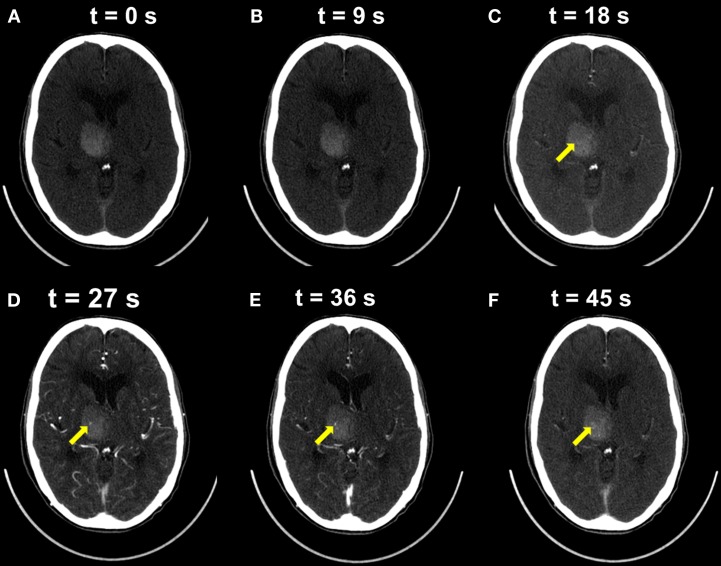
Figure 6.
The dynamic evolution of a CT Perfusion Spot Sign. A 86-year old female patient presenting within 105 min of symptom onset. Individual frames extracted from a dynamic CT perfusion study are presented. (A,B) No contrast enhancement is seen within the first 9 s. (C,D) At 18 s early contrast is seen within a CT Spot Sign, peaking at 36 s (E). Dissipation of contrast material is seen on delayed image at 36 s (F).

