
Figure 4.
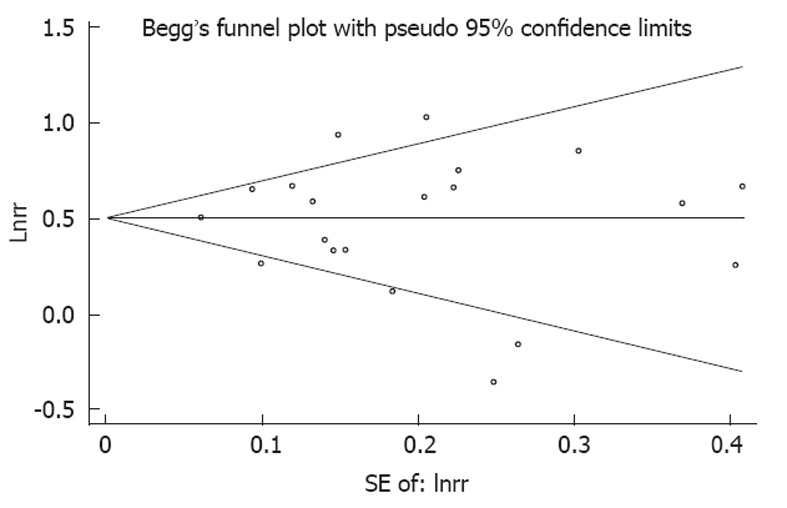
Evaluation of publication bias using a funnel plot. No significant funnel asymmetry was observed which could indicate publication bias. The horizontal line in the funnel plot indicates the random effects summary estimate, while the sloping lines indicate the expected 95% CI for a given standard error, assuming no heterogeneity between studies. Each trial is represented by a circle, the area of which represents the trial’s precision. Larger circles represent trials that offer more information.