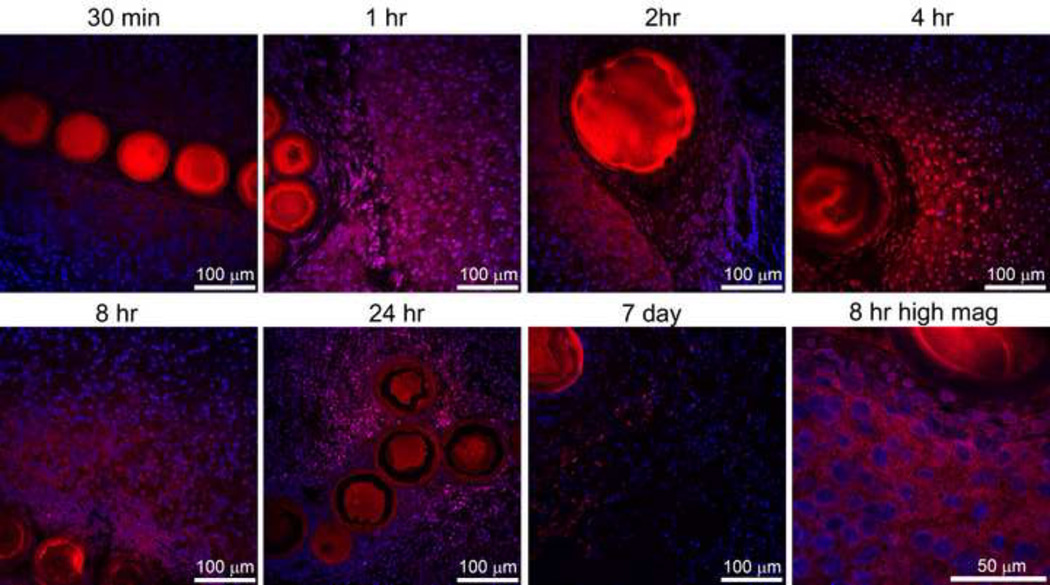
Figure 4.
Doxorubicin distribution surrounding radiopaque drug eluting beads with confocal microscopy. Doxorubicin (red) and nuclei (blue) levels were adjusted to best appreciate the distribution. All images are identical magnification with 100 µm bar except for the higher magnification image at 8 hr included in lower right panel (bar = 50 µm). Both 70–150µm and 100–300 µm radiopaque drug-eluting beads are included in this figure.

