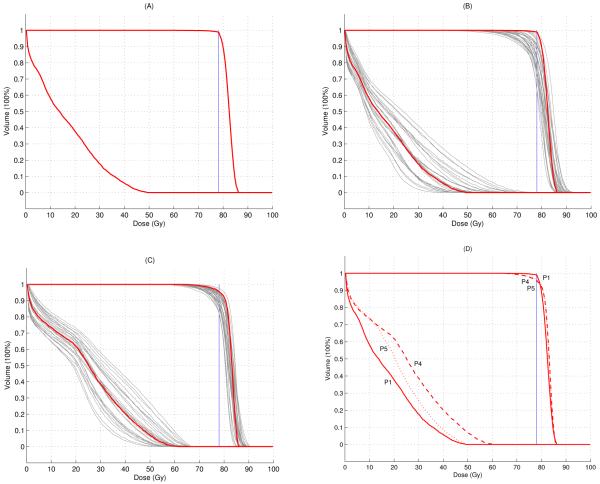
Figure 5.
(A) The nominal DVH of the non-robust plan (P1 in Figure 4). (B) The DVHs in 29 scenarios of the non-robust plan (P2 in Figure 4). (C) The DVHs in 29 scenarios of the 29 scenarios optimized robust plan (P3 in Figure 4). (D) Comparison of the nominal DVHs for three plans: solid line: nominal plan (P1 in Figure 4), dashed line: robust plan (P4 in Figure 4), dotted line: robust plan with optimized nominal brainstem dose (P5 in Figure 6). Nominal scenario DVHs are in red and error scenarios are in gray.

