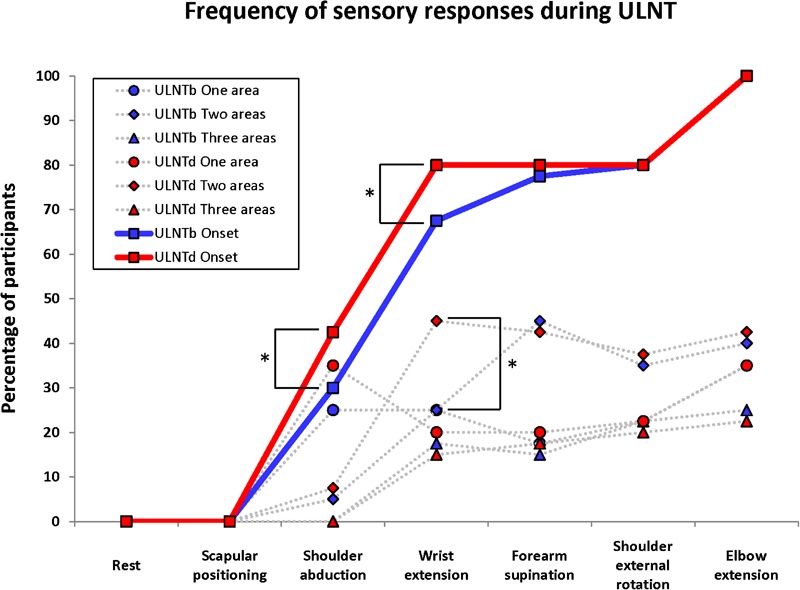
Figure 3.

Sensory responses during ULNT are presented. Blue data points represent the ULNTb and red data points represent the ULNTd. The onsets of sensory responses are indicated by boxes with a solid line showing the cumulative percentages throughout the testing sequences. The number of areas within the limb that were reported to have sensory responses is presented as circles (one area reported), diamonds (two areas reported) and triangles (all three areas reported) with the dashed line. Asterisks (*) indicate significant differences between ULNTb and ULNTd.
