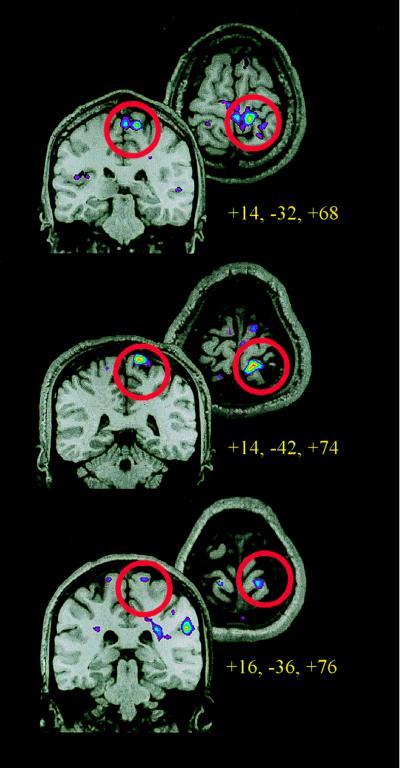
Figure 3.
Functional MRI data from three subjects, using a 1.5-T scanner and standard head coil. Each horizontal and coronal image represents the anatomical and functional data from a single subject during one session, which included a high-resolution anatomical scan and five to eight runs of 120 whole-brain functional MRI scans (10–13) 7-mm slices acquired at 3-sec intervals. Thermal stimuli were applied to the left calf on separate runs. Thermal runs consisted of 9 s alternating cycles of rest, painful (45–46°C), rest, and neutral (35–36°C) stimulation by using a 9 cm2 thermode. Activation maps were generated by using Spearman’s rank order correlation, comparing painful to neutral heat. The coronal and horizontal slices through S1 are centered at the activation peaks, and red circles surround the region of S1.

