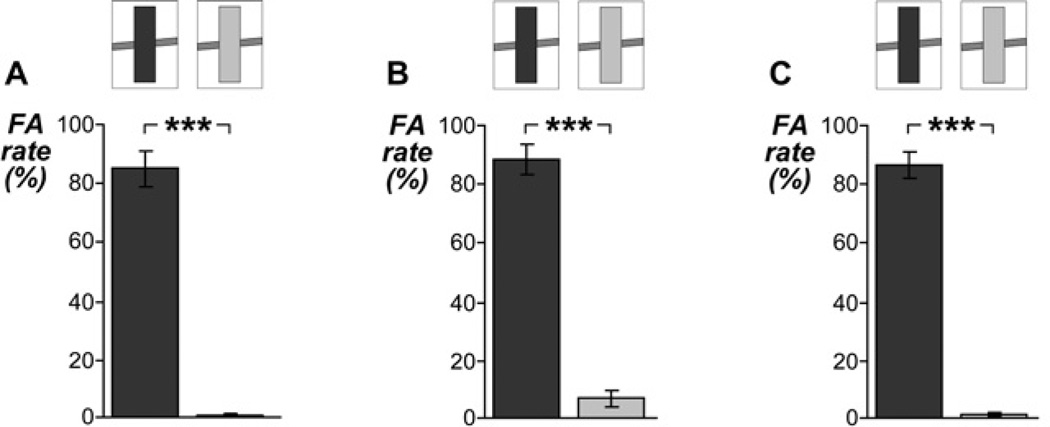
Figure 2. Ratings of adaptor stimuli in experiments 1–3.
The graphs show proportions of continuity reports of the adaptor stimuli in experiment 1–2 (A–B) and of the pre-adaptor stimuli in experiment 3 (C). The different stimuli are indicated by the upper schematic spectrograms. Listeners judged the loud adaptor (dark gray) mostly as ‘continuous’ (false alarm [FA]) and the soft adaptor (light gray) mostly as ‘discontinuous’. All graphs show means ± SE across listeners. *** P < 0.0005.

