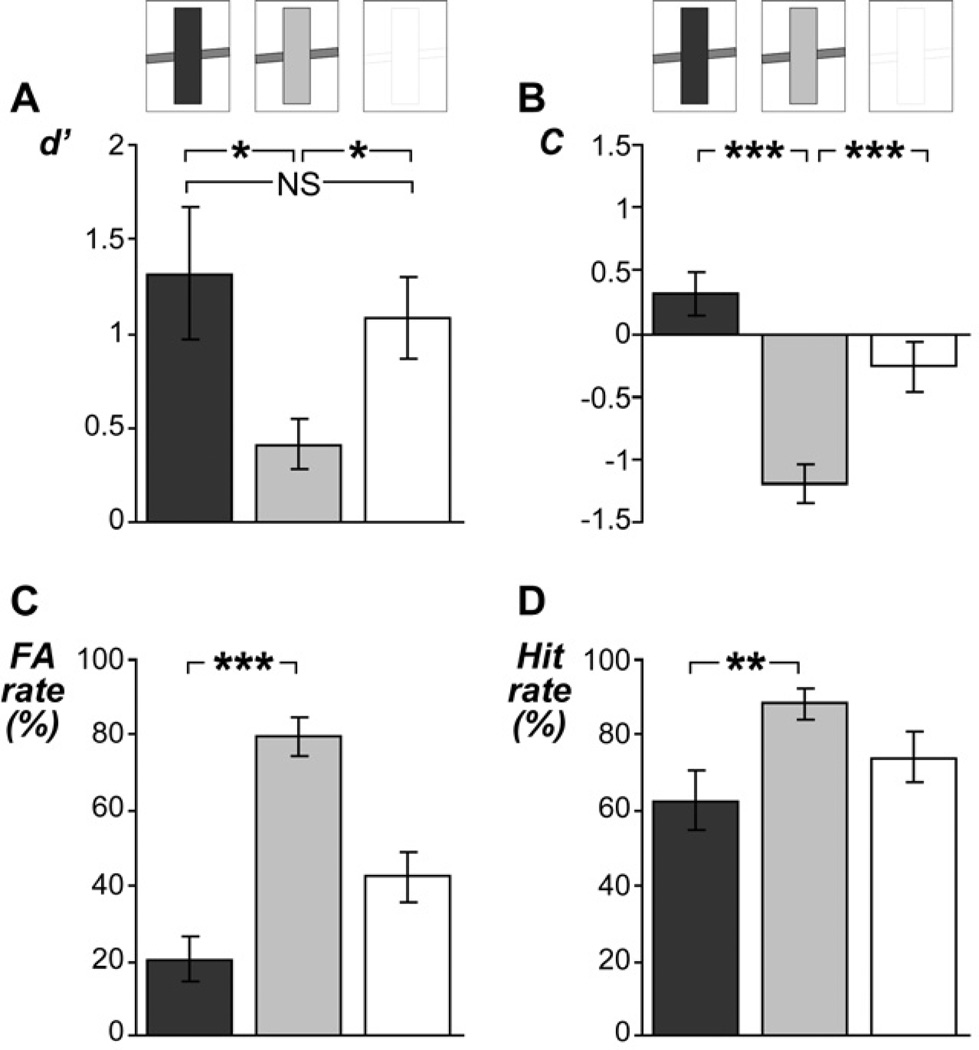
Figure 3. Ratings of target stimuli in experiment 1.
A, The bar graph shows listeners’ sensitivity (as measured by d’) following the different adaptor stimuli or following silence (indicated by the upper stimulus spectrograms). Following the loud adaptors (dark gray) or silence (white), listeners could easily identify whether the target stimuli were truly interrupted or truly uninterrupted, as shown by d’-values far above zero in these conditions. Following soft adaptors (light gray), however, listeners perceived the different target stimuli as more similar, as reflected by significantly smaller d’-values in this condition. B, Significant aftereffects on listeners decision criterion (as measured by C) were observed, indicating that following soft adaptors, listeners used a more liberal decision criterion (i.e., they were more inclined to report the target as ‘continuous’). C, Following the soft adaptors, listeners rated the interrupted target mostly as ‘continuous’, and vice versa following the loud adaptors. Without prior adaptors, the interrupted target was ambiguous (i.e. FA rates were around the chance level of 50 %). D, Similar but smaller contrastive aftereffects were found for hit rates (i.e., continuity reports of the uninterrupted target). All graphs show means ± SE across listeners. *, **, ***: P < 0.05, 0.005, 0.0005; NS: not significant.

