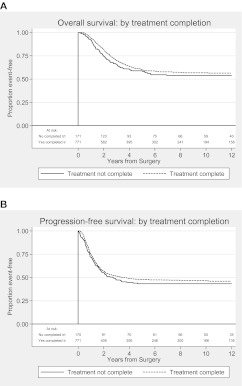
Figure 2.
Kaplan–Meier plots for (A) overall survival and (B) progression-free survival by treatment completion. Treatment complete: all protocol-specified cycles of chemotherapy given and treatment not complete: any other number of cycles. Patients who stopped protocol treatment due to progression of disease were excluded from this analysis. Reasons for non-completion were toxicity, patient choice and ‘other’.

