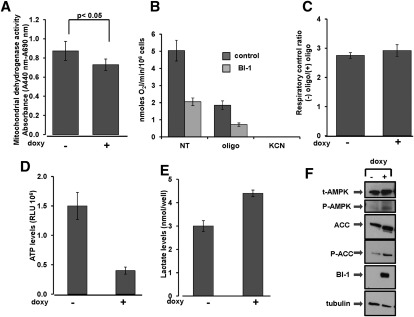
Figure 6.
BI-1 reduces mitochondria bioenergetics. (A) Activity of mitochondrial dehydrogenases was measured in control ([−] doxy) and BI-1 overexpressing ([+] doxy) HeLa cells. Values were normalized for the number of viable cells (trypan blue exclusion). Background absorbance was read at 690 nm and subtracted from readings at 440 nm (A440nm − A690nm). The difference between samples was significant (P < 0.05, by unpaired t-test). (B) Endogenous oxygen consumption rates in control (no doxy) and BI-1-overexpressing (doxy) cells were monitored by an oxymeter before (NT) and after exposure to oligomycin (2 μM) and FCCP (1 μM). Results are expressed as nanomoles of O2 per minute per 1 × 10⁶ cells. Results for untreated control versus BI-1-expressing cells were statistically significant (P = 0.0015). (C) RCR in control ([−] doxy) and BI-1 overexpressing ([+] doxy) cells was calculated by dividing O2 consumption before and after addition of oligomycin. The efficiency of oxidative phosphorylation coupling was comparable in control and BI-1-overexpressing cells. (D) ATP levels were measured in control versus BI-1-overexpressing cells using a bioluminescence method. Data represent relative luminescence units (RLUs) per 106 viable cells (mean ± SD; n = 3; P = 0.002. (E) Levels of extracellular lactate were measured in control ([−] doxy) and BI-1-overexpressing ([+] doxy) cells. Results are represented as nanomoles of lactate per well (mean ± SD; n = 3; P = 0.021. (F) Lysates from control versus BI-1-overexpressing cells were normalized for total protein content and subjected to immunoblot analysis to detect AMPK, phospho-AMPK, acetylCoA carboxylase (ACC), and phospho-acetylCoA carboxylase (P-ACC). Anti-HA antibody was used to detect expression of BI-1-HA protein. Equivalent sample loading was shown by monitoring tubulin levels.

