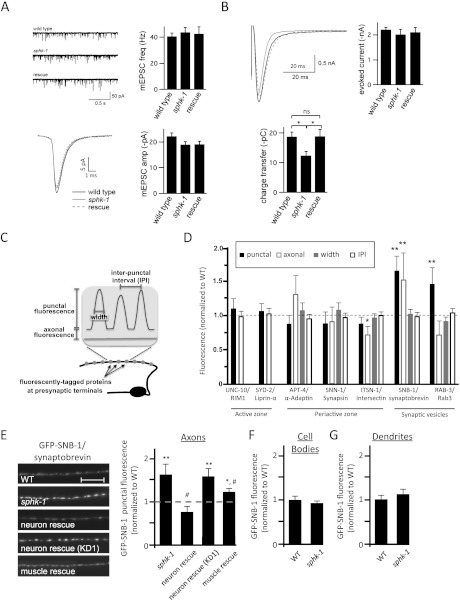
Figure 2.
Synaptic transmission and vesicle cycling defects in sphk-1 mutants. (A) Quantification of endogenous mEPSCs in wild-type (WT), sphk-1 mutant, and P.sphk-1 rescue animals. (Top left) Representative traces of mEPSCs. (Top right) Quantification of the mEPSC frequency: wild-type animals (40.7 Hz ± 2.5 Hz; n = 5), sphk-1 mutant animals (48.8 Hz ± 3.6 Hz; n = 9), and P.sphk-1 rescue animals (42.5 Hz ± 5.6 Hz; n = 6). (Bottom left) Representative traces of the average mEPSC. (Bottom right) Quantification of mEPSC amplitude: wild-type animals (22.2 pA ± 1.3 pA), sphk-1 mutant animals (19.0 pA ± 1.2 pA), and P.sphk-1 rescue animals (19.1 pA ± 1.2 pA). (B) Quantification of evoked EPSCs in wild-type, sphk-1 mutant, and P.sphk-1 rescue animals. (Top left) Representative traces of evoked current. (Top right) Quantification of the peak amplitude: wild-type animals (2.2 nA ± 0.1 nA; n = 8), sphk-1 mutant animals (2.0 nA ± 0.2 nA; n = 8), and P.sphk-1 rescue animals (2.1 nA ± 0.2 nA; n = 5). (Bottom left) Quantification of total charge transfer: wild-type animals (18.8 pC ± 1.6 pC), sphk-1 mutant animals (12.4 pC ± 1.4 pC), and P.sphk-1 rescue animals (18.9 pC ± 2.3v). Asterisks indicate values that differ between the groups shown; (*) P < 0.05. (C) Schematic of the quantification method used to determine the abundance of fluorescently tagged proteins at synapses (punctal) and between synapses (axonal), synapse size (width), and synapse number (interpunctal interval [IPI]) of DA motor neurons. (D) Analysis of the abundance of a panel of YFP- or GFP-tagged SV proteins in sphk-1 mutants, normalized to wild type (dotted line). (E, left) Representative images of GFP-tagged synaptobrevin (GFP-SNB-1) in DA motor neurons in the indicated strains. Motor neuron rescue was performed by expressing cDNA for full-length or a kinase-dead (KD1) sphk-1 under the unc-129 promoter and muscle rescue under the myo-3 promoter. (Right) Quantification of GFP-SNB-1 punctal fluorescence, normalized to wild type (dotted line). Bar, 10 μm. (F,G) Quantification of GFP-SNB-1 fluorescence in cell bodies (F) and punctal fluorescence in dendrites (G) of wild type and sphk-1 mutants. Values are normalized to wild type. For all quantification, asterisks indicate values that differ significantly from wild type, and pound signs indicate values that differ from sphk-1(ok1097) mutants ([*] P < 0.05; [**] P < 0.005; [#] P < 0.05; one-way ANOVA and Tukey's post-hoc tests; [ns] not significant).

