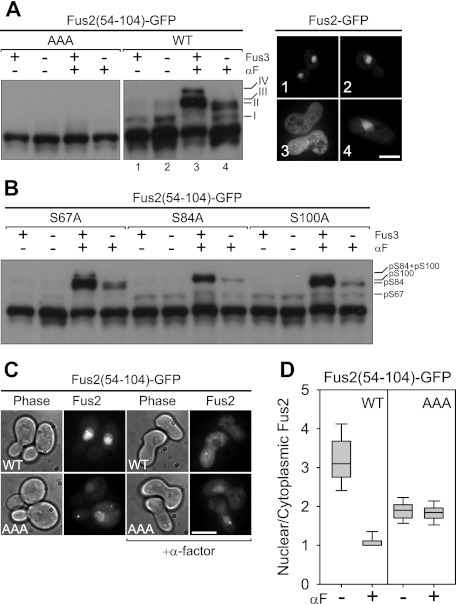
Figure 2.
The regulation of Fus2p nuclear localization by phosphorylations close to the NLS and NES. (A,B) Fus2p54–104 mutants (pMR6170, pMR6009, pMR6166, pMR6165, and pMR6169) were expressed in FUS3 (MY10174) or fus3Δ cln3Δ (MY10273) cells under the GAL1 promoter for 90 min during mitosis or after α-factor arrest for 2 h. GFP fluorescence was observed in living cells (A) and samples were run on 50 μM Phos-tag gels (A,B). AAA refers to residues 67, 84, and 100. (A) Each number of GFP fluorescence corresponds to that of lane in the immunoblot. Bar, 5 μm. (C,D) Fus2p54–104 (pMR6009) and AAA (pMR6170) mutants were expressed in fus2Δ (MY10174) under the GAL1 promoter for 90 min during mitosis or after α-factor arrest for 2 h. GFP fluorescence was observed in living cells (C), and its intensity of the nucleus relative to the cytoplasm was quantified (D) as described in the Materials and Methods. (C) Bar, 5 μm. (D) The lines inside the box and whisker plots indicate the median, the rectangles show the central 50%, and the error bars indicate the entire range.

