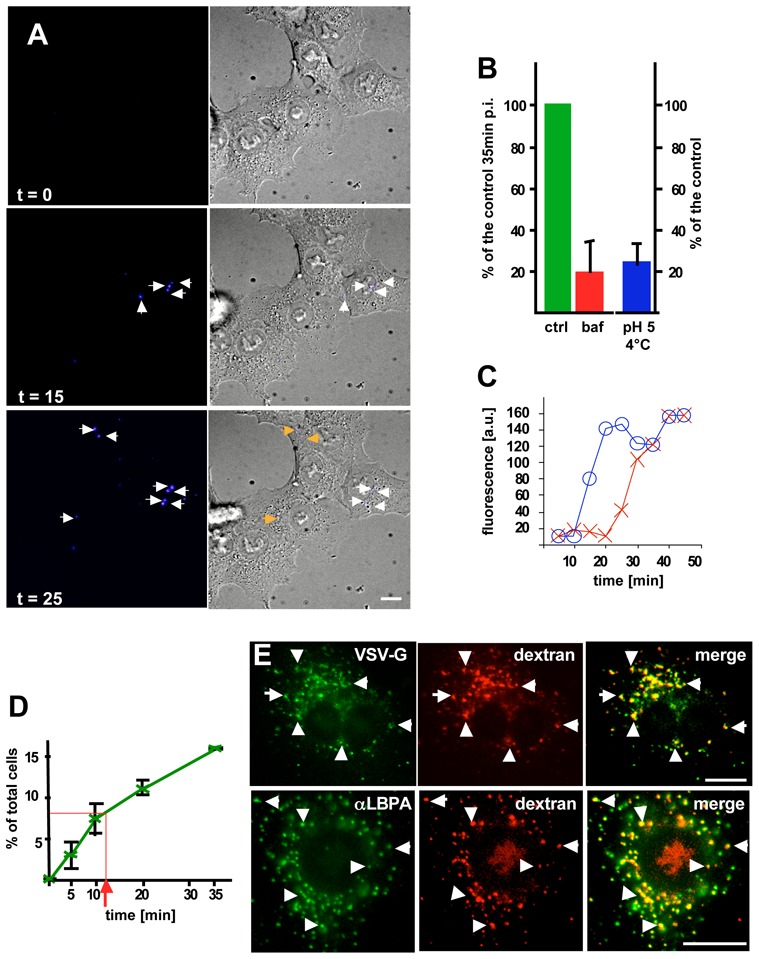
Figure 1. VSV fusion.

(A) BHK cells were incubated with low amounts (0.3 MOI) Dil-labeled VSV at 4°C. The temperature was raised to 37°C, and cells were imaged by time-lapse confocal microscopy. The figure shows frames captured at the indicated time, and arrows point at fluorescent spots that represent fusion events. (B) Cells were treated as in (A) in the presence (baf) or absence (ctrl) of 1μM bafilomycinA1. The number of cells containing fused viruses was counted after 35 min at 37°C (post-infection: p-i ). Alternatively, cells with bound virions were incubated at pH 5.0 at 4°C, and fusion events were immediately counted and expressed as a percentage of the control at 37°C. (C) The figure shows two representative examples of the endocytic time-course of viral fusion (as in A): the emitted fluorescence was quantified after tracking each spot in the sequence. (D) The number of cells treated as in (A) containing fused viruses was counted at the indicated times during the 37°C incubation, and is expressed as a percentage of the total cell number. (E) Excess virus (50μg/1.3x107 cells) were pre-bound to the cell surface (as in A), and then co-endocytosed with rhodamine-dextran for 5 min at 37°C, followed by a 40 min chase without dextran. Cells were processed for immnofluorescence and labeled with the indicated antibodies. VSV-G colocalized with endocytosed dextran (upper panels), which itself colocalized with LBPA (lower panels). Number of experiments: B, 3; D, 4. Bars, A: 2,5μm; E: 4μm.
