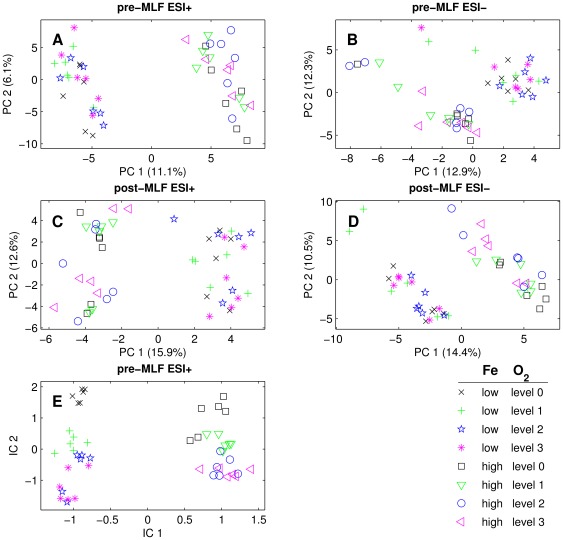
Figure 3. The principal component analysis plots, only applied separately for the candidate biomarkers in each experiment, showed clear group classification of the two metal levels (Panels A–D).
In Panel E the candidate biomarkers of both oxygen and metal pre-MLF ESI+ experiments are jointly used to plot an independent component analysis ICA graph. The groups in which no oxygen was added are clearly separated from the others, in the case of both high and low levels of metal.

