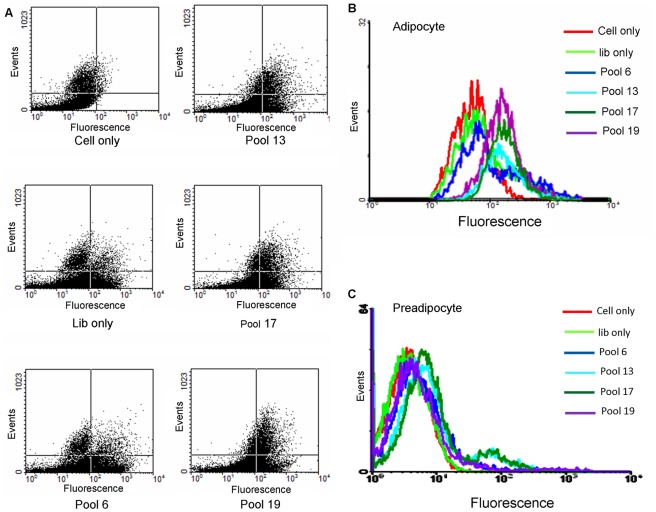
Figure 1. Flow cytometry results for selected pools (500 nM) with differentiated 3T3-L1 adipocyte and preadipocyte cells.
(A) Dot plot of flow cytometry with selected pools. (B) Flow cytometry assay to monitor the pool enrichment for differentiated 3T3 adipocytes. (C) The slight shift of the respective pools to control 3T3-L1 preadipocyte was recovered by counter selection.

