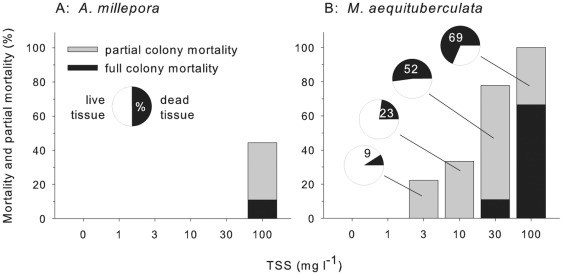
Figure 3. Whole and partial mortality of both species after 12 weeks (n = 9).
The black bars represent whole colony mortality and the grey bars partial mortality. The proportion of the surface area of M. aequituberculata (mean %) that was dead in partial mortality colonies is represented by black slices in pie charts.

