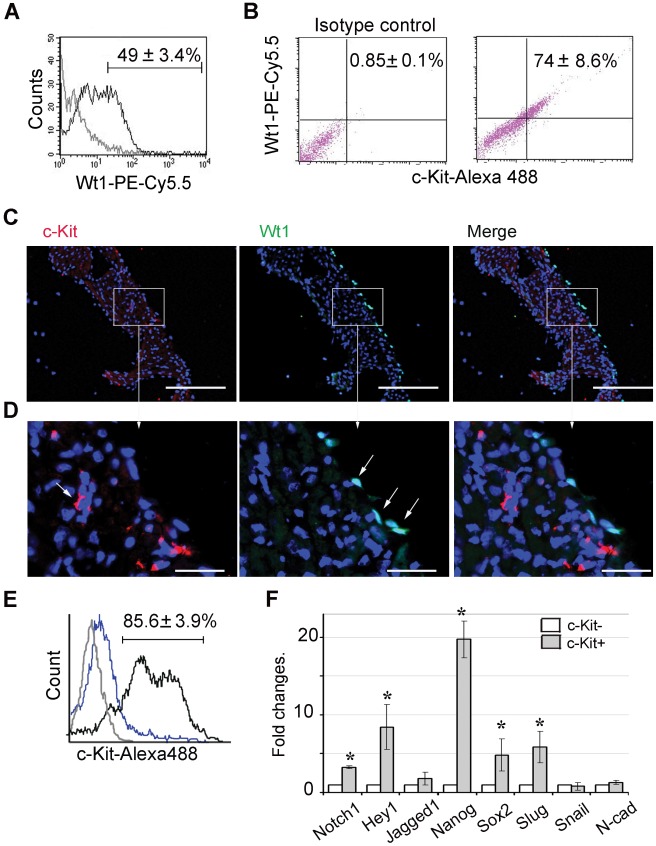
Figure 2. Characterization of c-Kit+ cells isolated from total outgrowths.
(A) Flow cytometry analysis of outgrowths cultured for 21 days shows percent of Wt1+ cells. (B) FACS analysis of double c-Kit and Wt1 labeling. Percentage of c-Kit+/Wt1+ cells indicated in upper right quadrant of histogram was calculated as a ratio of c-Kit+/Wt1+ (UR) to the total number of c-Kit+ cells (UR + LR). (C–D) Heart coronal sections are labeled with anti c-Kit (red) or anti Wt1 (green) antibodies. Nuclei were stained with DAPI (blue). Right column represents merged images of consecutive sections labeled with c-Kit and Wt1. (C) Representative images of left atrium are shown. Scale bar, 100 µm. (D) Higher magnification of the area selected in the box. Scale bar, 20 µm. (E) Purity of c-Kit+ and c-Kit- cell populations were confirmed by FACS analysis. C-Kit+ (black) and c-Kit- (blue) cells were labeled with anti-c-Kit antibody followed by secondary antibody conjugated with Alexa 488. For negative control, isotype IgG was used instead of primary antibody (grey). Representative histogram is shown. (F) qRT-PCR analysis of c-Kit+ and c-Kit- cell populations. Expression levels were normalized to the level of β-actin, fold changes were calculated as a ratio of expression in c-Kit- group to expression in c-Kit+ group, * p<0.05.

