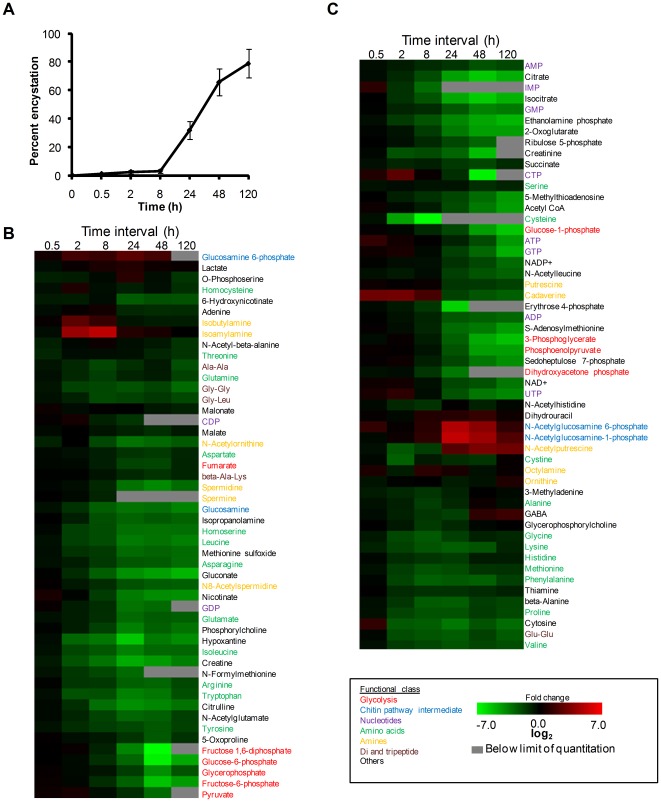
Figure 1. Change in metabolites during encystation.
(A) Kinetics of encystation. The percentages of the amoebae resistant to 0.05% sarkosyl during encystation are shown. (B and C) Heat map produced by hierarchical clustering of metabolites profiles obtained from CE-TOFMS analysis. Rows correspond to metabolites and columns correspond to time intervals. Shown are 104 metabolites detected during encystation. Metabolites levels are expressed as log2 of the fold change with respect to time 0 h. Shades in red and green indicate an increase and decrease of metabolites, respectively, according to the scale bar shown at the bottom.

