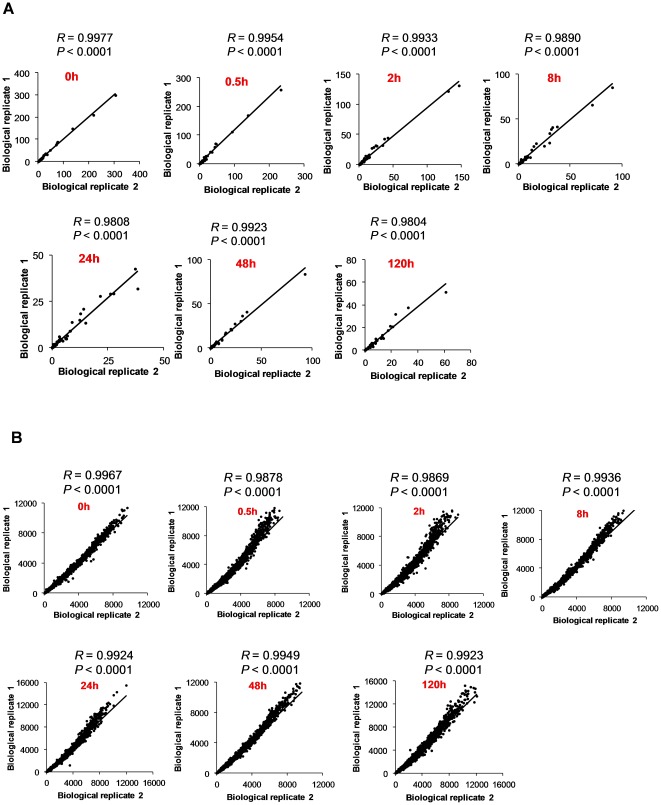
Figure 2. Correlation between two biological replicates.
The correlation of the levels of metabolites in metabolomic analysis (A) and transcripts in DNA microarray analysis (B) between first and second biological replicates at different time points during encystation is shown. The Pearson correlation coefficient and their P-values (two tailed) were calculated using GraphPad prism version 5.04.

