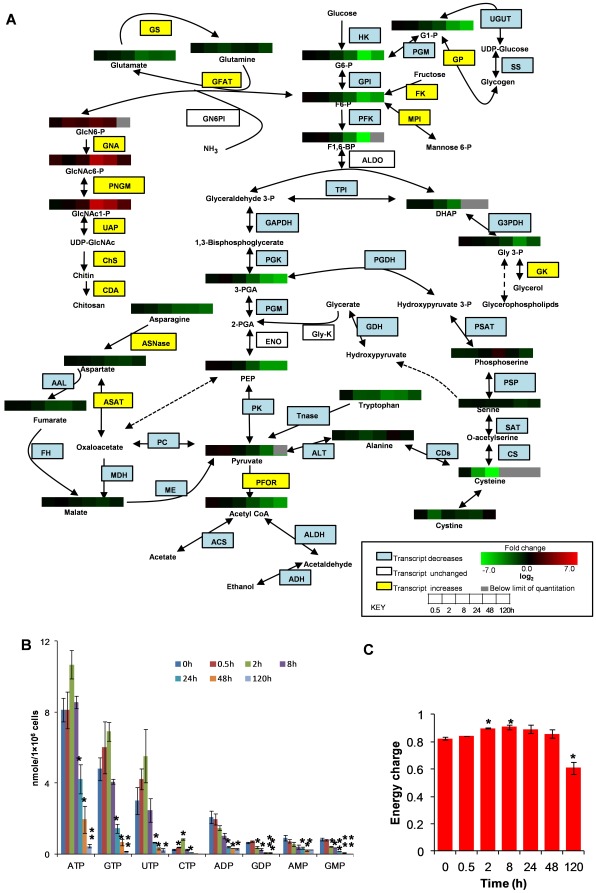
Figure 3. Central carbon metabolism during encystation.
(A) Alterations in the levels of metabolites involved in central carbon metabolism during encystation. The metabolite levels represented by heat map strip and the transcript levels shown in rectangles during encystation are superimposed on a metabolic pathway map that includes glycolysis, chitin biosynthesis, serine biosynthesis, and other related pathways. Metabolites levels are expressed as log2 of the fold change with respect to time 0 h. Shades in red and green indicate an increase and decrease of metabolites, respectively, according to the scale bar. The enzymes are shown in yellow or blue in case where their transcript levels increased or decreased by >3 fold relative to time 0 h, respectively. The entire quantitative metabolite data, as well as the indicator of statistical significance are given in Dataset S1. Abbreviations are: G 6-P, glucose 6-phosphate; G1-P, glucose 1-phosphate; F6-P, fructose 6-phosphate; F1,6-BP, fructose 1,6-biphosphate; DHAP, dihydroxy acetone phosphate; Gly 3-P, glycerol 3-phosphate; 3-PGA, 3-phosphoglycerate; PEP, phosphoenolpyruvate; GlcN6P, glucosamine 6-phosphate; GlcNAc6-P, N-acetylglucosamine 6-phosphate; GlcNAc1-P, N-acetyl glucosamine 1-phosphate; UDP-GlcN6P, UDP-glucosamine-6-phosphate. The full names of the enzymes denoted by abbreviations, the basal expression levels at time 0 h, and the fold changes relative to 0 h at different time points during encystation can be found in supplementary dataset S2. (B) The average concentration of the nucleotides at various time points during encystation. Data are depicted as means ± S. D. Statistical comparisons were made by Student's t test (* P<0.05, ** P<0.01). (C) Adenylate energy charge of the cell, which is calculated by the equation, [(ATP)+1/2(ADP)]/[(ATP)+(ADP)+(AMP)] during encystation. Data are shown as means ± S.D. Statistical comparisons were made by Student's t test (* P<0.05, ** P<0.01).

