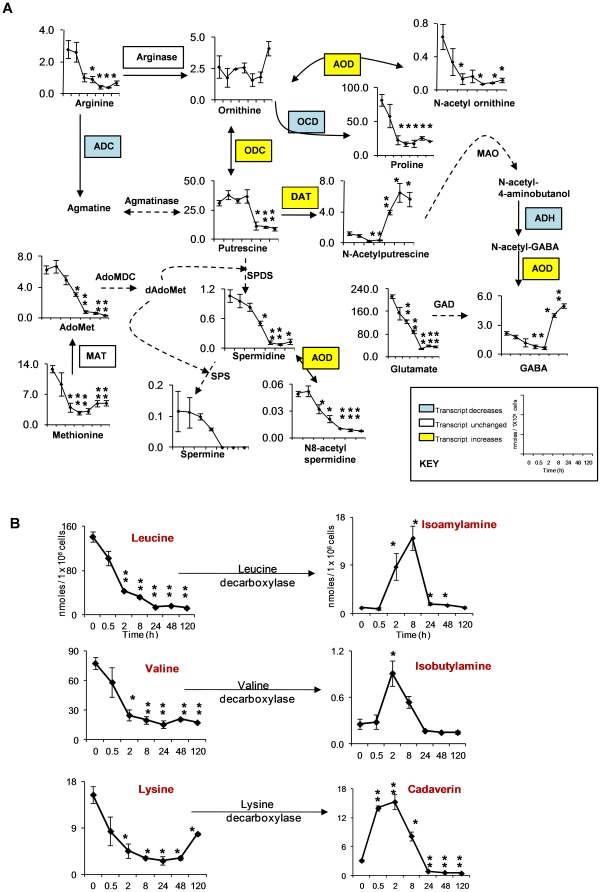
Figure 4. Polyamines and biogenic amines levels during encystation.
(A) Metabolome and transcriptome data of the pathway involved in biosynthesis and catabolism of polyamines and related metabolites from arginine. The average concentrations of each metabolite (nmol/1×106 cells) at time intervals (0, 0.5, 2, 8, 24, 48 and 120 h) are shown. The enzymes are shown in yellow or blue in case where their transcript levels increased or decreased by >3 fold relative to time 0 h, respectively. Abbreviations are: GABA, γ-aminobutyric acid; AdoMet, S-Adenosyl methionine; dAdoMet, S-adenosylmethioninamine. Solid lines represent the steps catalyzed by the enzymes whose encoding genes are present in the genome, whereas dashed lines indicate those likely absent in the genome. Abbreviations are: MAO, monoamine oxidase; AdoMDC, S-adenosylmethionine decarboxylase; SPDS, spermidine synthase; SPS, spermine synthase; GAD, glutamate decarboxylase. Data are shown as means ± S.D. Statistical comparisons were made by Student's t test (* P<0.05, ** P<0.01). (B) Level of some biogenic amines and its precursors during encystation. X-axis represents time in hours, whereas Y-axis represents the concentration of metabolites in nmoles/1×106 cells. Data are represented as means ± S.D. Statistical comparisons were made by Student's t test (* P<0.05, ** P<0.01).

